For B2B marketing professionals managing Google Ads campaigns, the rising cost of digital visibility has become an increasingly complex challenge to decipher. Recent research conducted by the digital agency Grey Matter provides a rigorous, data-driven look into a phenomenon that many search marketers have felt but struggled to quantify: the escalating cost of the exact same non-branded keywords. According to the agency’s October 2026 report, B2B advertisers experienced a roughly 21% increase in cost-per-click (CPC) for identical keywords between April and September 2026 compared to the same period in the previous year. This analysis, which isolates variables such as ad position, spending fluctuations, and Quality Score, offers a rare, granular look at market-driven cost inflation versus advertiser-driven bidding strategies.
The study, titled "Same Click, Higher Price," serves as a vital reference point for search managers. By isolating 1,349 non-brand keywords across 14 distinct B2B client accounts, Grey Matter sought to answer a fundamental question: Is the rising cost of search advertising a result of broader market dynamics, or is it a byproduct of individual campaign management choices?
A Methodology Designed for Isolation
The complexity of Google Ads reporting often makes it difficult to differentiate between organic market shifts and deliberate changes in bidding strategy. To address this, Andy Hendricks, head of search at Grey Matter, designed a study that prioritized consistency. By excluding broad match keywords—which can fluctuate in intent and relevance—and filtering out "Maximize Clicks" campaigns, the researchers ensured that they were comparing apples to apples.
The data set spans six quarters, from April 2025 to September 2026. The core year-over-year comparison focuses on the second and third quarters of 2026, juxtaposed against the same period in 2025. The methodology relied on a regression model that controlled for critical variables, including total campaign spend, impression share lost due to budget constraints, top-of-page positioning, and the ever-important Quality Score. By giving each of the 14 advertisers equal weight, the model prevented high-spending outliers from skewing the results, providing a balanced view of how these costs impacted a variety of B2B entities.
The findings demonstrate a clear progression in cost analysis. When viewing raw data with no controls, the cost of these keywords appeared to be 29% higher year-over-year. However, once researchers adjusted for spend-related variables, that figure dropped to 22%. After further refining for ad position and Quality Score, the final estimate settled at 21%. This suggests that while market competition is a significant driver, tactical choices by advertisers—such as increasing budgets or chasing higher positions—also contribute significantly to the final CPC.
The Correlation Between Spend and CPC Inflation
One of the most compelling insights from the report is the quantifiable relationship between increased advertising budgets and rising CPCs. The regression model suggests that for every 10% increase in campaign spend, advertisers see a roughly 1.4% rise in CPC on the exact same keywords, independent of general market inflation. If an advertiser were to double their spend, they could expect an approximate 11% increase in their CPC, simply due to the nature of how Google’s automated bidding systems interact with expanded budgets.
In the most extreme case observed during the study, one advertiser nearly quadrupled its non-brand search spend year-over-year. Consequently, its same-keyword CPCs surged by 132%. Interestingly, the same advertiser maintained a flat budget for its brand keywords, which saw a much more modest increase of 4% during the third quarter. This discrepancy highlights the role of automated bidding strategies, such as "Maximize Conversions." These systems are designed to utilize larger budgets by entering auctions that the advertiser previously avoided—auctions characterized by higher competition, more expensive times of day, and more aggressive bidding environments.
The Waterfall of Cost Drivers
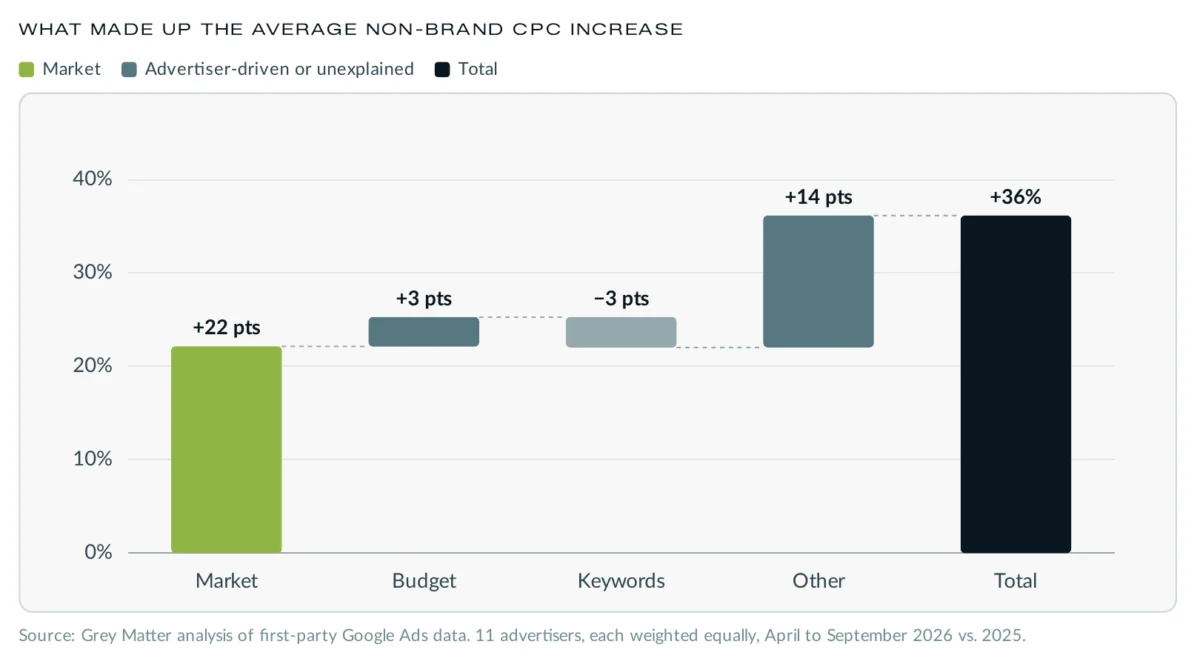
To further unpack the 36% average increase in non-brand CPC observed among 11 of the participating advertisers, Grey Matter employed a "keyword price index." This allowed for a breakdown of the contributors to cost inflation. The analysis revealed that 22 percentage points of the increase could be attributed directly to market conditions (the "rising tide" of auction prices). Increased spending by the advertisers themselves accounted for three percentage points, while adjustments to keyword match types and bidding strategies actually provided a three-point deduction.
However, this still leaves 14 percentage points of the increase unexplained by traditional metrics. The report suggests that these residual points are likely the result of competitive intensity within specific, high-value categories, where bidding wars for top-of-page placement become increasingly expensive. For some participants, the actual CPC changes varied wildly, ranging from a 30% decrease to a 121% increase, proving that while the 21% estimate is a useful benchmark, individual performance remains highly dependent on industry context and account maturity.
Industry Context and the "High CPC Paradox"
It is important to note that this report measures costs, not necessarily the efficiency of those costs. In the modern landscape of digital marketing, a higher CPC is not inherently a sign of failure. Industry observers, such as Jyll Saskin Gales, have previously argued that under sophisticated Smart Bidding, a rising CPC often signals a healthy, high-intent account. If an advertiser is paying more for clicks, they are often doing so because the algorithm has identified a higher probability of conversion.
Because the Grey Matter report does not include conversion rates or return on ad spend (ROAS) data, it cannot definitively state whether the 14 advertisers saw a decline in profitability. The data highlights a "High CPC Paradox": advertisers are paying more to participate in the same auctions, but they may be reaching more qualified prospects as a result. Nevertheless, the lack of performance data means that marketing leaders must exercise caution when interpreting these figures; a 21% increase in cost is only problematic if the conversion volume or quality does not scale accordingly.
Navigating the Alphabet Disconnect
The 21% increase identified by Grey Matter stands in stark contrast to the 4% year-over-year increase in CPC for Google Search reported by Alphabet in its third-quarter 10-Q filing. This discrepancy is not an indication of faulty data, but rather a difference in scope. Alphabet’s figure is an aggregate metric that encompasses all clicks globally, across all devices, geographies, and product mixes. It is heavily influenced by shifts in user behavior—such as the increasing use of mobile devices or changes in regional search trends—and changes in product mix.
In contrast, the Grey Matter report is a controlled study of specific, static keywords within a narrow segment of B2B accounts. These two figures measure entirely different aspects of the search ecosystem. Alphabet’s report reflects the price of the "average click" across the entire Google ecosystem, while Grey Matter’s research reflects the price of the "same click" within a controlled B2B environment. Both are accurate, but they serve different purposes: one for macroeconomic analysis and the other for granular campaign strategy.
Implications for 2027 Budgeting
As B2B organizations look toward their 2027 fiscal planning, the "Same Click, Higher Price" report offers actionable guidance. The primary takeaway is the necessity of a gradual, iterative approach to scaling. Rather than authorizing blanket budget increases, marketing managers should scale budgets incrementally and conduct a "same-keyword check" at each stage. By comparing the year-over-year cost of a static list of keywords against the account’s overall average CPC, marketers can begin to see the hidden impact of their own bidding strategies and match-type adjustments.
For campaigns heavily reliant on automated bidding, the report advocates for a strategy of constraint: determine the value of a conversion before adjusting the budget, and set targets that reflect that value. This approach prevents the "automated trap," where the algorithm spends more simply because the budget is available, rather than because the auction offers a better return on investment.
Ultimately, the 21% figure serves as a vital benchmark, but it is not a prediction. Given that the study’s range varies from 1% to 44%, it is clear that market volatility is high. The report serves as a reminder that in an automated world, the "same" keyword is rarely the same experience. As competition intensifies and bidding algorithms become more aggressive, the ability to isolate and understand these cost drivers is no longer just a tactical advantage—it is a requirement for maintaining profitability in the B2B search channel. By moving beyond simple CPC averages and focusing on the underlying mechanics of their auction participation, B2B advertisers can navigate the inflationary pressure of the current search landscape with greater precision and confidence.