
As digital advertising expenditure continues to shift heavily toward moving imagery—with current estimates indicating that roughly one out of every five digital advertising dollars is allocated specifically to social video—marketing departments face mounting pressure to accurately measure and report on their visual campaigns. Far beyond simple vanity metrics, modern social video analytics serve as the fundamental bridge between creative production and verifiable business outcomes. In an era where corporate budgets require rigorous defense and headcount approvals depend on concrete data, understanding how to track, interpret, and leverage social video metrics has transformed from a secondary marketing task into a core operational necessity.

The Evolution and Importance of Social Video Analytics
Historically, digital measurement was dominated by static impressions and basic click-through rates. However, the maturation of social media ecosystems across platforms like YouTube, Instagram, TikTok, Facebook, LinkedIn, and X has forced a structural evolution in how performance is evaluated. Social video metrics encompass the quantitative indicators that reveal how frequently video assets are viewed, how deeply audiences interact with them, and what concrete actions viewers take subsequently.
Industry experts emphasize that robust video marketing metrics do not merely document historical performance; they provide actionable intelligence that shapes smarter content creation, optimizes cross-channel campaigns, and fosters deeper connections with target demographics. When marketing teams must justify expenditures to executive leadership, raw aesthetic appeal is insufficient. A structured suite of performance indicators tied directly to revenue generation, customer pipeline expansion, or organic reach is what transforms a standard quarterly report into executive buy-in. Consolidating these data points through centralized analytics platforms has largely replaced the cumbersome practice of stitching together fragmented screenshots from multiple native dashboards.

Core Performance Indicators and Strategic Alignment
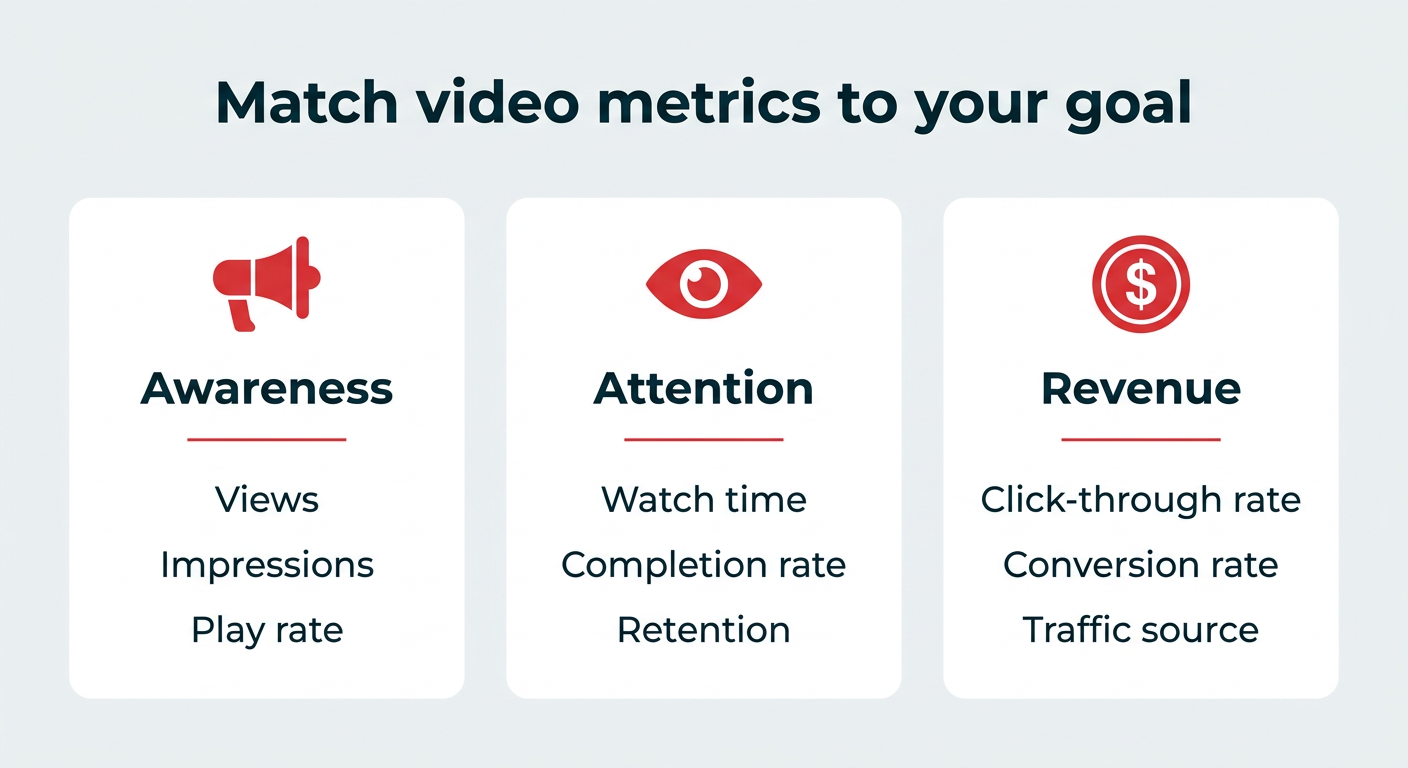
Selecting the appropriate video metrics depends entirely on the overarching objectives of a campaign. Objectives spanning top-of-funnel brand awareness require a vastly different measurement framework than community-building initiatives or bottom-funnel conversion strategies. Industry standards generally categorize these key performance indicators into distinct operational tiers:
- Brand Awareness: Evaluated primarily through view counts, total impressions, overarching reach, and initial play rates.
- Engagement and Community: Measured by comprehensive engagement rates, active commentary, content shares, and saves or bookmarks.
- Audience Retention: Assessed via average watch time, drop-off timelines, and total video completion percentages.
- Conversion and Financial Return: Tracked through specific conversion rates, click-through rates (CTR), and detailed traffic source analytics.
Professionals advise narrowing analytical focus to two or three key performance indicators that align seamlessly with specific campaign goals, avoiding the distraction of tangential data points that do not influence the final outcome.
Breaking Down the Top Eleven Social Video Metrics
To evaluate performance comprehensively across all publishing channels, digital marketers track eleven primary social video metrics, each serving a distinct diagnostic purpose.
-
View Count
View count measures the absolute number of times a video has been initiated or watched. While simple, it remains a vital indicator for brand awareness and total reach. However, platform-specific definitions vary significantly. YouTube typically classifies a view after 30 seconds of watch time (or completion for shorter clips), whereas Facebook and Instagram often register views almost immediately upon playback, and platforms like TikTok, LinkedIn, and X initiate counting between one and two seconds under specific viewport conditions. While essential for understanding scale, historical controversies regarding inflated metric reporting on major platforms underscore why view counts must be supplemented with deeper qualitative data.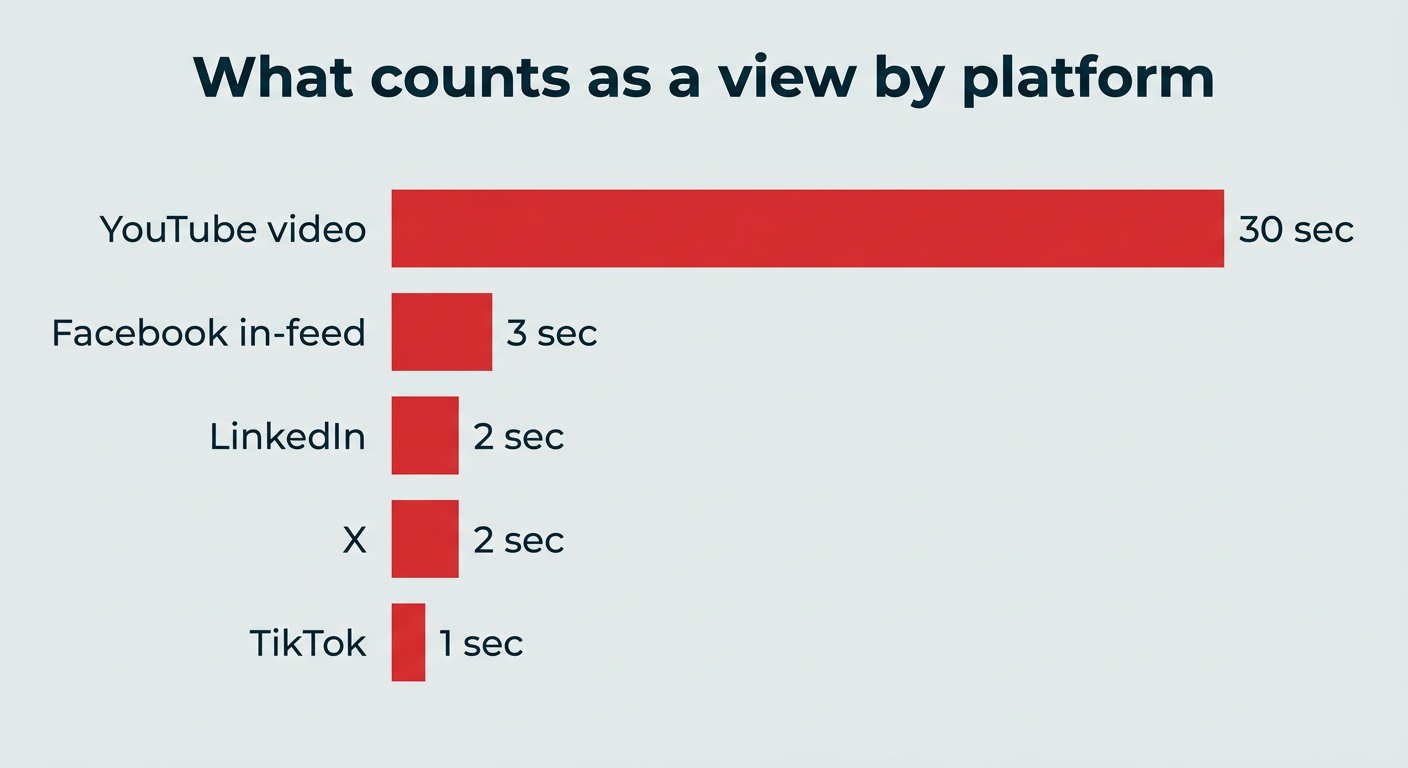
-
Engagement Rate
Engagement rate aggregates likes, comments, shares, and saves to gauge how deeply content resonates with an audience. Industry leaders frequently emphasize that active interaction signals algorithmic favorability. Comparing internal engagement metrics against broader industry benchmarks allows organizations to contextualize their performance relative to direct competitors. -
Average Watch Time
Average watch time reveals the duration viewers remain engaged before abandoning the content. Serving as a primary indicator of content quality, it guides everything from video structuring to optimal runtime. For instance, a high drop-off rate within the opening seconds typically points to a weak introductory hook, whereas extended watch times relative to video length indicate high replay value.
-
Video Completion Rate
Calculated as the percentage of viewers who watch a video from inception to the final frame, completion rate indicates whether the latter half of a production successfully sustains audience interest. Because algorithms favor content that retains viewers through to the conclusion, understanding completion thresholds helps creators refine pacing and trim unnecessary narrative lag. -
Play Rate
Play rate measures the percentage of users who chose to initiate playback after encountering a video thumbnail or placement. By dividing total plays by total impressions, marketers evaluate the persuasive strength of their initial visual presentation, thumbnail design, and surrounding editorial copy.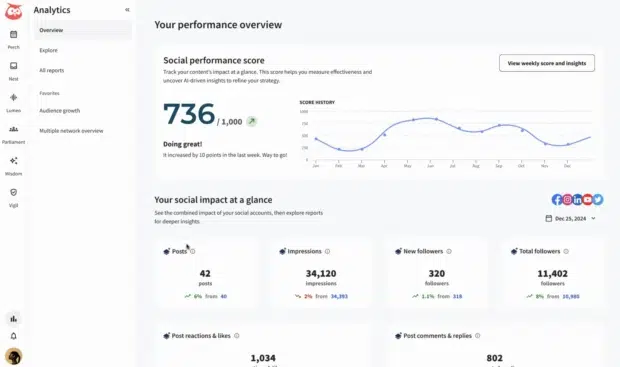
-
Click-Through Rate (CTR)
Click-through rate calculates the proportion of viewers who transition from passive consumption to active engagement by clicking a designated link or call-to-action (CTA). Particularly critical for paid campaigns, product launches, and lead generation, CTR measures a video’s direct efficacy in driving external traffic. -
Shares
Shares represent instances where viewers distribute video content via direct messaging or publish it to their personal feeds and stories. Serving as a digital form of word-of-mouth marketing, share volume heavily influences algorithmic distribution and organic amplification.
-
Saves
Saves—or bookmarks and favorites—indicate that viewers found content valuable, instructional, or memorable enough to archive for future reference. Because saving requires deliberate user effort, it functions as a strong vote of confidence and serves as a major ranking signal for recommendation engines. -
Traffic Source
Traffic source analytics identify the precise pathways through which viewers discovered content, whether via internal platform search engines, algorithmic feeds, profile visits, or external web shares. Understanding these sources dictates where organizations should allocate distribution resources and optimize keyword strategies.
-
Conversion Rate
Conversion rate monitors the percentage of viewers who complete a desired commercial action—such as newsletter subscriptions, software downloads, or product purchases—after viewing the video. Utilizing tracking parameters and platform conversion pixels enables precise attribution of on-site revenue back to specific creative assets. -
Retention and Drop-Off Points
Retention graphs illustrate the exact second-by-second progression of audience retention, identifying precise moments where viewers lose interest. This diagnostic capability allows content strategists to pinpoint pacing errors and optimize narrative structures for maximum sustained attention.
Cross-Platform Measurement Realities
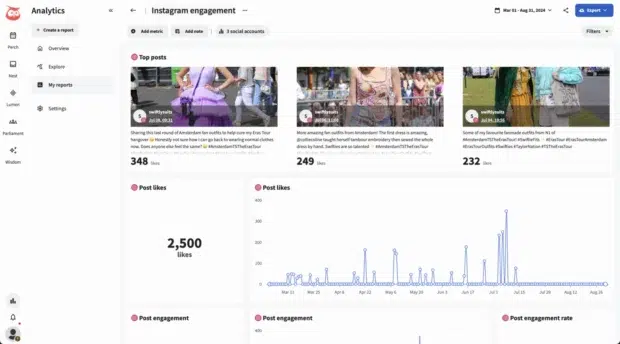
Because individual social networks utilize distinct structural definitions for foundational metrics—such as varying view thresholds across YouTube, Meta, TikTok, and LinkedIn—cross-channel reporting presents ongoing operational challenges. Standardized multi-channel dashboards assist marketing teams in reconciling disparate data streams, allowing for accurate trend analysis and benchmark comparisons without requiring manual data consolidation.
Industry Perspectives and Strategic Optimization
Leading marketing professionals emphasize several fundamental principles for maximizing video performance. Foremost among these is treating the opening three seconds of any video as high-value digital real estate. Overcoming the inherent scroll reflex requires urgent, highly specific hooks that immediately communicate value without relying on deceptive clickbait tactics. Furthermore, content creators advocate matching video length precisely to platform psychology and campaign objectives—adhering to the philosophy of making videos "as short as possible, as long as necessary."
Additional optimization strategies include engineering "loopable moments" designed for repeat viewing, which naturally boosts watch time metrics, and experimenting with emerging AI-native formats that translate complex informational documents into digestible, highly authentic visual explainers.
Calculating and Defending Video ROI
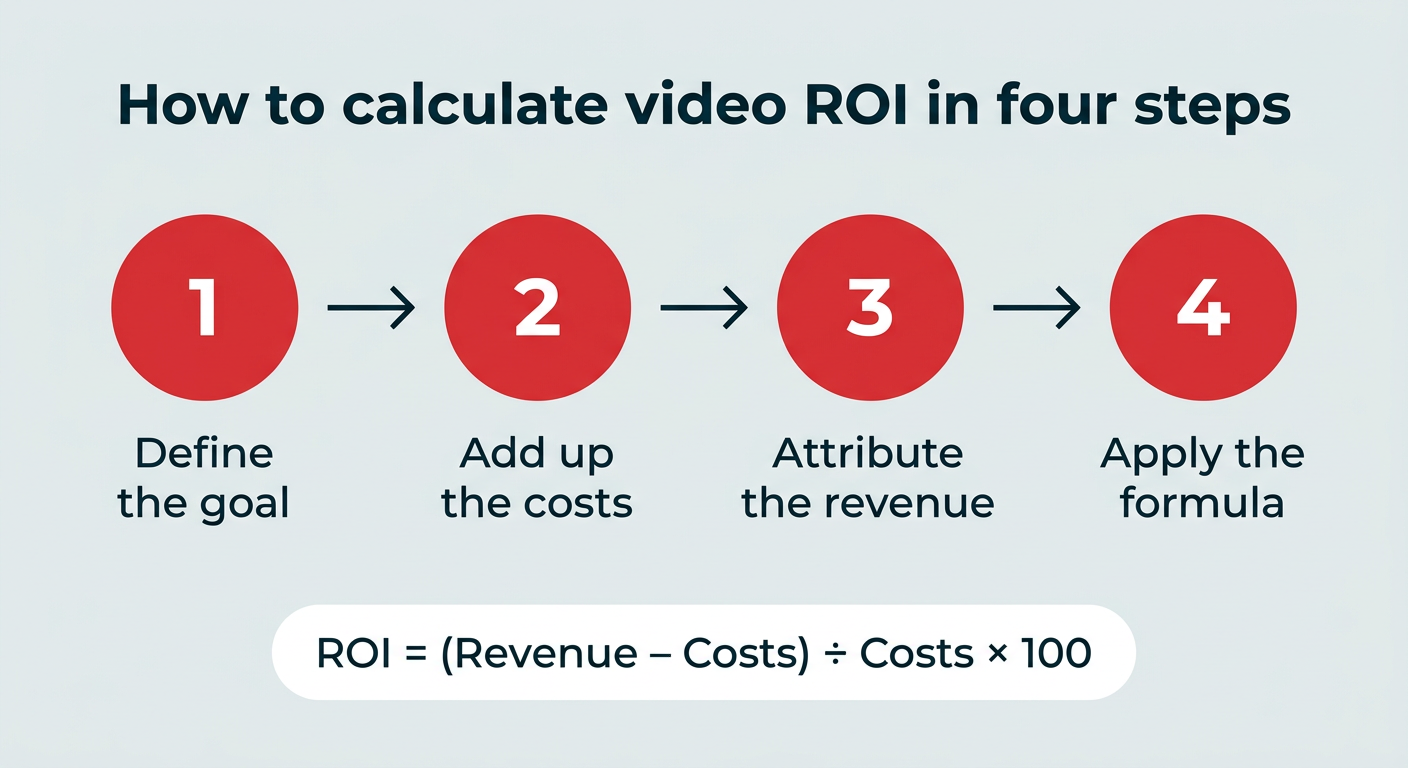
Establishing verifiable return on investment (ROI) remains one of the most formidable tasks for social marketing teams. Calculating video ROI requires a four-step methodology: defining specific financial goals, tracking total campaign costs (encompassing production, paid amplification, and tooling), measuring attributed revenue using conversion parameters and tracking pixels, and applying the standard financial formula: subtracting total costs from attributed revenue, dividing by total costs, and multiplying by 100.
While bottom-funnel performance videos easily map to direct revenue attribution, top-of-funnel awareness campaigns are more appropriately evaluated through cost-per-thousand impressions (CPM) or cost-per-view metrics. Maintaining clarity regarding measurement criteria ensures executive reporting remains credible and defensible.
Conclusion
As the digital landscape continues its aggressive pivot toward video-first consumption, the ability to accurately capture, interpret, and report on social video metrics is paramount. By moving beyond superficial view counts and focusing on comprehensive retention, engagement, and conversion analytics, organizations can definitively prove the business impact of their creative investments. Centralized analytical dashboards and standardized reporting templates ultimately empower marketing teams to transform complex data streams into actionable strategies, securing long-term growth and sustained competitive advantage.