LinkedIn is stepping up its commitment to the professional creator economy by rolling out a comprehensive suite of advanced performance analytics. The professional networking platform, owned by Microsoft, has shared deep insights into its latest analytics infrastructure designed to help users evaluate their content strategies with unprecedented precision. These upgrades arrive as part of a broader, multi-phase rollout aimed at enhancing creator tools, driving meaningful engagement within the main feed, and expanding monetization opportunities for influential voices on the network.
The initiative bridges a historical gap for LinkedIn, which has traditionally lagged behind consumer-focused platforms like Meta, TikTok, and YouTube in offering granular, creator-centric data dashboards. By giving professionals, thought leaders, and businesses clearer visibility into what content resonates with their target audiences, LinkedIn hopes to cement its status not just as a resume repository, but as a vibrant, content-first publishing ecosystem.
The Evolution of LinkedIn Creator Tools
The genesis of this current analytics overhaul traces back to strategic shifts initiated by LinkedIn over the past several years. Recognizing the explosive growth of independent creators, thought leadership marketing, and B2B influencing, the platform introduced "Creator Mode" in 2021. This feature allowed users to pivot their profiles toward content generation, granting them access to follower metrics, newsletter tools, and LinkedIn Live.
Building on that foundation, last month LinkedIn announced a sweeping modernization of its creator ecosystem. This update bundled brand-new monetization pathways—such as sponsored content programs and subscription models—with a redesigned profile insights dashboard. Creators immediately recognized the potential of these features, though early feedback highlighted a desire for deeper, more centralized data access rather than piecemeal statistics.
Answering this call, Sam Corrao Clannon, Director of Product, Content at LinkedIn, took to the platform to detail how the newly introduced analytics elements function in practice. Clannon emphasized that the primary design philosophy behind the update is frictionless efficiency: saving creators time while offering diagnostic depth.
Deconstructing the Post Performance Table
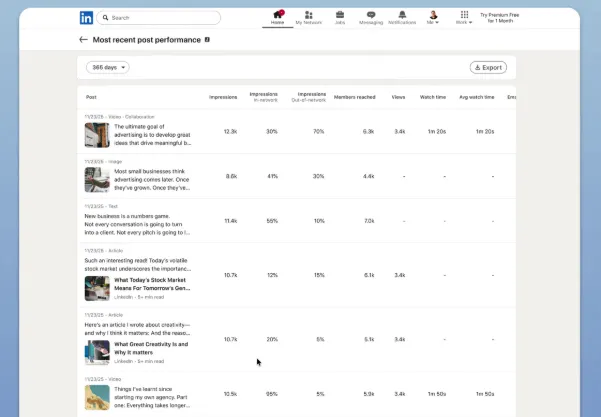
At the heart of the latest update is the new Post Performance Table. Historically, creators seeking to understand their content’s reach had to click through individual posts one by one, manually cross-referencing metrics like impressions, click-through rates, and engagement ratios. This cumbersome process made longitudinal analysis and content auditing exceedingly time-consuming.
The new Post Performance Table consolidates critical post information and key performance metrics into a single, cohesive listing view. According to demonstration materials shared by LinkedIn product leadership, the interface neatly tabulates impressions, unique views, and watch-time statistics across multiple posts simultaneously.
By eliminating the friction of individual post auditing, creators can instantly spot performance anomalies. For instance, a user can quickly scan a month’s worth of content to identify which specific article format, video length, or text-heavy post drove the highest watch times or view counts. Clannon noted that this streamlined presentation enables users to compare key metrics side-by-side "without needing to open the analytics for each one of your posts individually," drastically reducing the administrative burden of content management.
Key Metrics and Enhanced Data Granularity
Beyond the new table layout, LinkedIn has refined several underlying metric elements to provide a more accurate reflection of audience behavior. In the digital marketing landscape, vanity metrics like raw impressions often fail to tell the whole story of audience engagement. LinkedIn’s updated analytics framework attempts to solve this by emphasizing actionable, attention-based data points.
The platform is introducing clearer delineations between passive visibility and active engagement. Watch time has emerged as a central metric, particularly given LinkedIn’s heavy push toward native video content over the past two years. As professional video consumption surges on the platform—mirroring trends seen across corporate training, product demos, and thought leadership interviews—creators need precise data on how long audiences actually stay engaged with visual media.
Furthermore, the updated dashboard provides refined demographic and firmographic insights. Because LinkedIn holds unique professional data regarding its user base—such as job titles, industries, company sizes, and geographic locations—its analytics can reveal not just how many people viewed a post, but who they are in terms of professional hierarchy. A B2B marketer can now evaluate whether their content is successfully penetrating C-suite executives, mid-level managers, or specific industry verticals with far greater confidence.
Official Responses and Platform Strategy
LinkedIn’s product and executive teams are treating this rollout as an iterative process. Clannon confirmed that the company is actively assessing how creators utilize these newly minted metrics in the wild. User behavior, feedback loops, and feature adoption rates will dictate the trajectory of future platform updates.
This analytical approach reflects a broader trend within the tech industry, where platforms must continuously court top-tier content creators to retain user attention and drive advertising revenue. By equipping creators with professional-grade analytics tools typically reserved for enterprise marketing software, LinkedIn is effectively professionalizing its creator class.
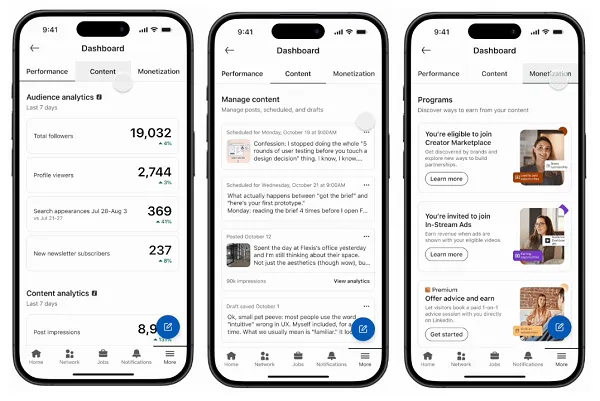
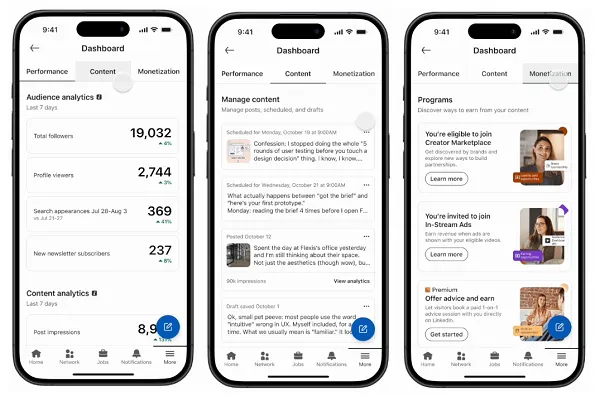
The push for better analytics does not exist in a vacuum. It is tightly coupled with LinkedIn’s aggressive development of monetization features. Driving engagement in the professional feed requires high-quality, consistent content. By offering robust monetization options alongside sophisticated performance tracking, LinkedIn is creating a self-sustaining economic loop: creators produce valuable professional content, analytics tools help them optimize that content, higher engagement drives platform growth, and monetization rewards the creators for their efforts.
Industry Implications and the Future of B2B Content
The implications of LinkedIn’s analytics upgrade extend far beyond individual content creators; they represent a fundamental shift in how B2B marketing and personal branding operate.
In the past, measuring the return on investment (ROI) of thought leadership on LinkedIn was notoriously difficult. Executives and professionals knew that maintaining an active profile yielded networking benefits, but quantifying that impact for corporate stakeholders or personal business ventures relied on crude approximations. With centralized performance tables, unified watch-time statistics, and deeper firmographic insights, professionals can now treat their LinkedIn presence with the same analytical rigor applied to paid digital advertising campaigns.
For agencies and enterprise organizations managing executive ghostwriting or employee advocacy programs, these tools are game-changers. Teams can now generate comprehensive performance reports that justify content expenditures, optimize publishing schedules based on empirical view data, and tailor messaging to high-value industry segments with surgical precision.
As LinkedIn continues to roll out these features across its global user base, the platform solidifies its position as a dominant force in digital media. By listening to creator feedback and delivering structural dashboard improvements, LinkedIn is signaling that the professional creator economy is no longer an experimental side project, but a core pillar of its long-term corporate vision. The coming months will reveal how creators adapt these new tools into their daily workflows, setting a new benchmark for professional publishing in the digital age.