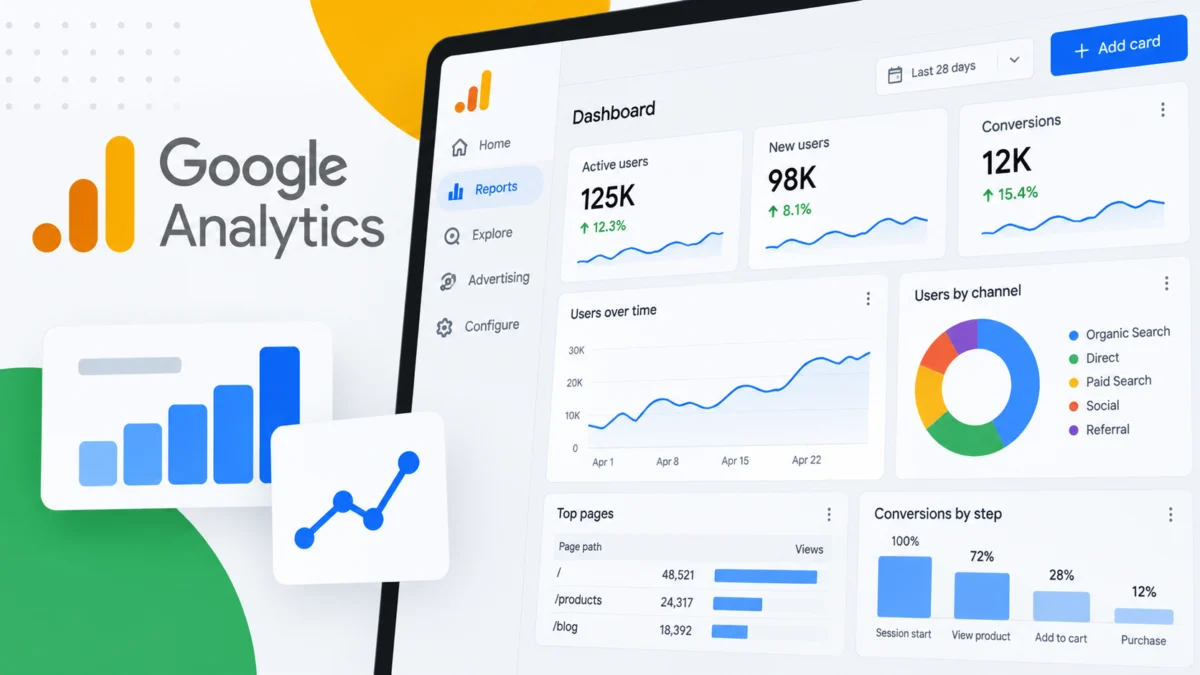
Google Analytics has officially rolled out a robust new feature known simply as Dashboards, designed to provide enterprises and digital marketers with a centralized, highly customizable workspace. This addition allows organizations to consolidate their critical Key Performance Indicators (KPIs) and data visualizations onto a single, cohesive report page. Moving away from rigid, pre-packaged templates, the modern digital marketing landscape requires agile reporting solutions, and Google’s latest release aims to minimize the friction traditionally associated with cross-referencing multiple data streams.
The core mechanism behind the newly launched Dashboards is a modernized, grid-based canvas. Rather than relying on traditional multi-step report creation workflows, users can now build and modify reports via an intuitive drag-and-drop interface. Analysts and marketing professionals are empowered to manually position, resize, and align various visualizations on a flexible grid. By dragging specific dimensions and metrics directly onto the canvas, teams can dynamically generate and fine-tune charts on the fly, eliminating the need to construct and export individual reports separately.
Diverse Visualization Options Tailored for Modern Enterprise Needs
At launch, Google Analytics Dashboards support six distinct visualization types, catering to a wide spectrum of analytical requirements. Scorecards are available for monitoring high-level KPIs, complete with percentage change indicators when date comparisons are applied. Detailed data breakdowns can be examined through comprehensive tables, while line charts—supporting daily, weekly, and monthly temporal views—offer clear visibility into performance trends over time.
Additionally, the suite includes bar charts for direct metric comparisons, donut charts for illustrating composition and categorical breakdowns, and funnel charts specifically designed to monitor conversion steps and drop-off points. This diverse array of visual tools ensures that marketing teams can tailor their views to match exact business objectives without needing to export raw data into external spreadsheet software or third-party visualization tools.
Publishing, Permissions, and Collaboration Frameworks

To streamline accessibility across an organization, published dashboards can be seamlessly integrated directly into the Reports left-hand navigation menu, bypassing the traditional Google Analytics library. However, governance and control remain strict: only users assigned an Editor or Administrator role possess the permissions required to create and publish a new dashboard.
Once a dashboard is published, it becomes accessible to anyone with viewing permissions for that specific Google Analytics property. Unlike private, user-specific drafts, these published resources are shared across the entire property, fostering a unified source of truth for internal marketing, executive, and operational teams.
Despite its extensive customizability, the initial rollout comes with certain structural limitations. Standard Google Analytics properties are capped at a maximum of 15 cards per dashboard, whereas premium properties support up to 30 cards. Furthermore, current limitations dictate that published dashboards are shared globally across the property rather than restricted to individual users. API support, advanced user segments, and card-level comparisons are not supported in this initial release, though industry observers anticipate future updates addressing these functional boundaries.
Contextualizing the Update: The Evolution of Web Analytics Reporting
To understand the significance of the new Dashboards feature, one must look at the broader evolution of digital analytics tools over the past decade. For years, digital marketers and data analysts operating within enterprise environments faced a common operational bottleneck: data fragmentation. While Universal Analytics offered basic dashboard functionality, the transition to Google Analytics 4 (GA4) placed a heavier emphasis on event-based data models, exploratory analysis, and custom reporting paths.
While GA4’s exploratory tools and custom report builders offered immense depth, they frequently required users to navigate across multiple distinct pages and menus to build a comprehensive overview of performance. This segmented workflow often hindered fast-paced decision-making, particularly for marketing teams managing multichannel campaigns where daily oversight of traffic, conversions, and revenue is paramount. The introduction of the drag-and-drop Dashboard interface represents a direct response to these usability challenges, bridging the gap between raw data collection and executive-level visibility.
Industry Implications and Strategic Value for Marketers

The debut of Dashboards carries notable implications for marketing departments, agencies, and enterprise organizations. By consolidating crucial reporting capabilities directly inside the Google Analytics interface, the tool significantly reduces the time spent compiling routine performance reports.
Instead of jumping between acquisition reports, engagement metrics, and monetization dashboards, businesses can now engineer a single-page operational hub containing the metrics that directly impact their bottom line. This centralized visibility is expected to accelerate performance monitoring cycles, allowing growth teams to spot anomalies, identify traffic dips, or track campaign momentum much faster than previously possible.
Furthermore, the democratization of published dashboards across a property ensures that cross-functional teams—from content creators to paid media specialists—are aligned around the same core metrics. This shared visibility minimizes discrepancies in reporting interpretation and encourages a data-driven culture throughout the organization.
Future Outlook and Ongoing Platform Enhancements
As Google continues to refine its analytics ecosystem, the rollout of Dashboards signals a continued commitment to user-experience optimization within GA4. While early versions lack advanced features such as API integration and card-level segmentation, the foundational infrastructure provides a strong springboard for future iterative updates.
Digital marketing professionals and platform administrators are encouraged to review the official Google Analytics documentation to understand how these limits and publishing capabilities apply to their specific accounts. By adopting these new visualization frameworks, organizations can transform complex event streams into accessible, actionable insights, cementing Google Analytics as both a data collection engine and an executive reporting powerhouse.