
The modern digital landscape is saturated with endless streams of content, fleeting trends, and unverified claims, creating an environment where consumer skepticism is at an all-time high. Recent global surveys indicate that a vast majority of adults believe social media platforms have made populations increasingly vulnerable to misinformation. In response to this digital fatigue, brands are shifting away from purely superficial engagement metrics toward content rooted in concrete evidence. Data storytelling—the practice of weaving quantitative facts, statistics, and figures into an engaging, cohesive narrative—has rapidly emerged as an essential strategy for organizations seeking to establish genuine authority and trust.

At its core, data storytelling bridges the crucial gap between logical deduction and emotional resonance. While raw statistics provide the necessary proof to validate a brand’s claims, a compelling narrative supplies the context, stakes, and human element required to make those numbers memorable. Industry experts emphasize that when brands utilize verified metrics effectively, they transform abstract digits into relatable stories that deeply connect with audiences. This comprehensive guide explores the foundational pillars, structural frameworks, and actionable steps required for marketers to successfully integrate data storytelling into their campaigns.
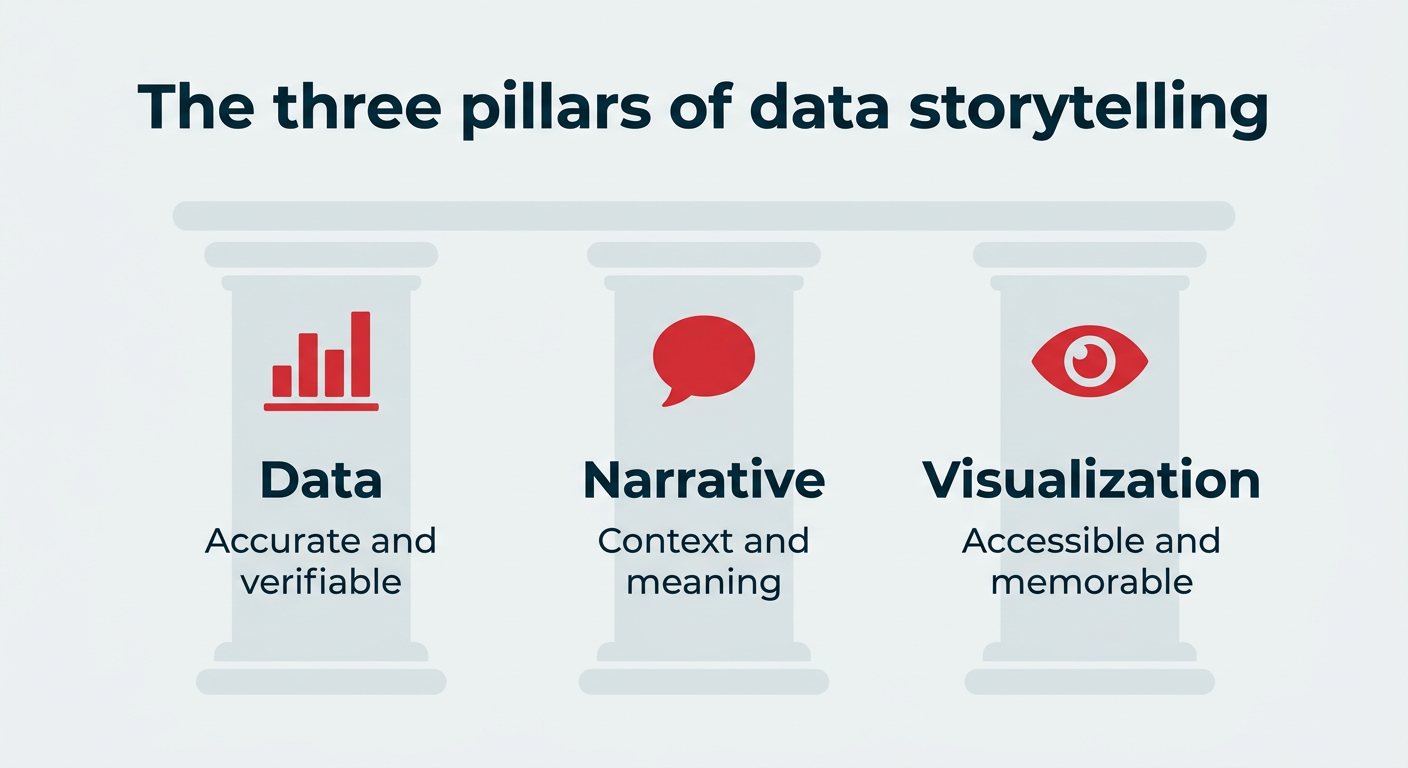
The Three Foundational Pillars of Data Storytelling
A successful data-driven narrative relies entirely on the harmonious integration of three essential components: data, narrative, and visualization. Eliminating any single pillar causes the entire communication effort to collapse. Data in isolation remains dry and academic; a narrative without supporting metrics lacks proof; and a standalone visual serves as mere decoration rather than communication.
The foundation of any data story must rest upon accurate, relevant, and verifiable information. Whether sourcing from trusted third-party research, academic institutions, or internal first-party metrics derived from sales analytics and consumer surveys, the origin of the information must be transparent and credible. Unverified statistics not only undermine audience trust but also expose brands to significant reputational risks.

The narrative layer provides meaning to the numbers by answering critical questions: Why does this matter now? Who is affected? What action should the audience take next? A percentage increase is merely arithmetic until framed within a context that illustrates its impact on real people or industries. Finally, visualization transforms complex metrics into accessible formats designed for rapid consumption. Because human brains process visual stimuli significantly faster than text, choosing the appropriate graphical representation—such as single-stat graphics for impact, bar charts for comparisons, or line graphs for temporal trends—ensures the message resonates instantly across fast-paced digital feeds.

Applying the 5 C’s Framework to Quantitative Narratives
To prevent data-driven content from deteriorating into an uninspired list of figures, marketers frequently adapt the classic narrative arc known as the 5 C’s: Context, Characters, Conflict, Climax, and Closure. When applied to quantitative storytelling, this framework provides a structured roadmap from introduction to resolution.

Context establishes the setting and explains why a trend or business problem matters at the present moment. Characters represent the focal point of the story, identifying the specific audience segment, customers, community members, or internal team affected by the issue. Conflict introduces the tension, illuminating the gap, operational waste, market risk, or missed opportunity uncovered by the quantitative research.

The climax serves as the turning point of the narrative, delivered through a headline statistic or critical insight that entirely reframes the issue for the viewer. Finally, closure provides resolution and a clear path forward, typically manifested as an actionable takeaway or a strategic call to action tied directly to the presented data. Utilizing this classic narrative structure ensures that data-driven posts possess a clear beginning, middle, and end, motivating audiences to engage and share.

A Seven-Step Blueprint for Executing Data Stories
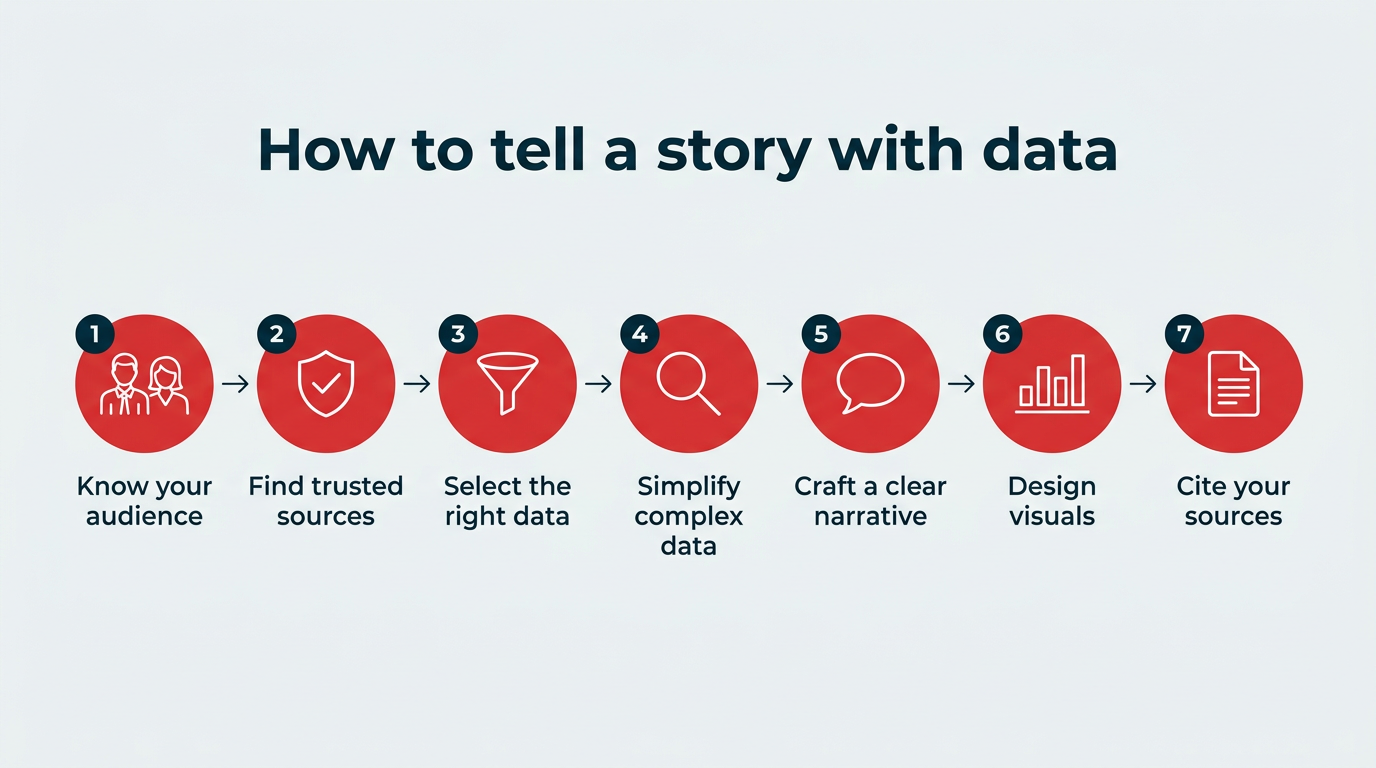
Successfully translating complex quantitative insights into digestible, shareable social media content requires a disciplined, methodical approach. Digital marketing professionals recommend a comprehensive seven-step execution process:

- Identify and Understand the Target Audience: Content creators must begin by defining precisely who they are addressing. Audience segmentation should extend beyond basic demographics to evaluate numerical literacy. While financial stakeholders may require raw figures and detailed methodologies, general consumer audiences respond far more favorably to relatable comparisons and high-level headline statistics.
- Source Credible and Verifiable Information: Protecting brand integrity requires strict reliance on professional, peer-reviewed, or officially verified data sources. Creators must avoid utilizing unvetted statistics circulated casually across social media platforms, ensuring internal metrics are rigorously double-checked prior to publication.
- Curate Selective and Relevant Data Points: An abundance of available information necessitates careful selection. Marketers should isolate specific metrics that exclusively support the core message of the campaign, omitting extraneous figures that dilute the central narrative.
- Simplify Complex Figures Through Analogy: Large, abstract volumes should be translated into everyday units of measurement. Converting massive production statistics into relatable equivalents—such as comparing annual manufacturing volume to familiar household containers—allows audiences to easily visualize scale.
- Craft a Clear and Compelling Narrative: Data must be contextualized within a framework that evokes emotional connection and trust. By establishing background context, presenting the verified statistic, and concluding with a logical next step, brands can effectively elevate simple figures into resonant stories.
- Design Accessible Visuals Tailored to Platforms: Visual presentation must align seamlessly with the chosen communication channel. Whether deploying multi-image carousels on Instagram, short-form video on TikTok, or professional infographics on LinkedIn, design elements must remain uncluttered, legible at thumbnail size, and free from distorted 3D effects.
- Maintain Absolute Transparency by Citing Sources: Credibility is reinforced when brands openly reference their information sources. Transparent citation practices demonstrate accountability, reassuring consumers that the organization values truth and responsibility alongside commerce.
Broader Implications and Strategic Advantages
The integration of data storytelling into digital communication strategies yields profound implications for modern brand authority. As digital platforms continue to expand and audiences grow increasingly wary of misinformation, transparently sharing verifiable metrics sets industry leaders apart from competitors. Data-led content provides clear performance signals, enabling marketing teams to accurately demonstrate return on investment and strategic value to executive leadership.

Furthermore, distilling complex concepts into concise, visually appealing narratives accommodates the behavioral preferences of modern digital consumers, who frequently seek efficient, meaningful communication. By successfully capturing attention through verified insights and guiding audiences toward deeper resources, organizations can foster long-term loyalty, drive meaningful engagement, and solidify their position as trustworthy authorities within their respective industries.