2025 Cross-Sectional Engagement Survey and American Trends Panel Wave 179 Methodologies Unveiled by Pew Research Center


Pew Research Center, a nonpartisan fact tank, has meticulously detailed the robust methodologies underpinning two of its critical studies conducted in 2025: the Cross-Sectional Engagement Survey and Wave 179 of the American Trends Panel (ATP). These surveys are foundational to understanding the intricate dynamics of public life in the United States, providing insights into how Americans engage with politics, news, religion, and various civic activities. The transparent and rigorous approaches employed by Pew Research Center, in collaboration with SSRS, underscore a commitment to capturing a nuanced and representative portrait of the U.S. adult population.
The 2025 Cross-Sectional Engagement Survey: A Deep Dive into Public Participation
The 2025 Cross-Sectional Engagement Survey was a significant undertaking designed to explore the diverse ways U.S. adults participate in public life. Conducted by SSRS for Pew Research Center, the survey utilized an address-based sampling (ABS) methodology coupled with a multimode protocol, ensuring a broad and inclusive reach across the nation. The fieldwork spanned nearly five months, from July 9 to December 5, 2025, reflecting the extensive efforts required to gather comprehensive data.

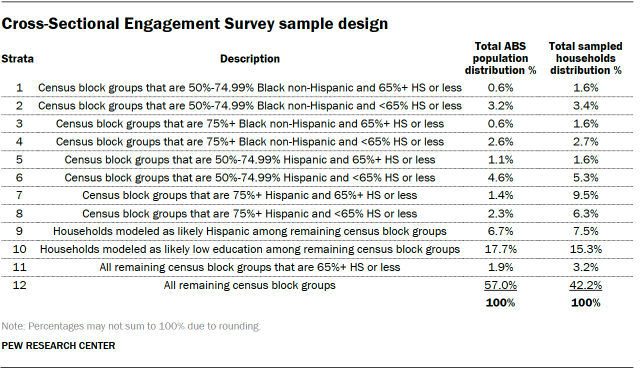
Sampling Strategy and Reach: The foundation of the survey’s representativeness was its sample, drawn from the U.S. Postal Service Computerized Delivery Sequence File and provided by Marketing Systems Group (MSG). This database ensures that virtually all occupied residential addresses across all U.S. states, including Alaska and Hawaii, and the District of Columbia, had a non-zero chance of selection. The design featured a national, stratified random sample, employing differential probabilities of selection across mutually exclusive strata to ensure adequate representation of various demographic segments. This careful stratification is crucial for capturing the rich diversity of the American populace, accounting for geographical and socio-economic variations.
Multimode Data Collection Protocol: Recognizing the evolving landscape of survey participation and the need to maximize response rates, the survey adopted a comprehensive multimode approach. Initial contact involved mailing invitations to sampled addresses, encouraging participants to complete an online survey. This digital-first strategy leverages the widespread internet access among U.S. adults. For those who did not respond to the initial online invitation, a paper survey was subsequently mailed, catering to individuals who might prefer or require an offline format. Furthermore, both mailings provided a toll-free number, allowing participants to complete the survey over the phone with a live interviewer. This layered approach is a hallmark of modern survey research, designed to overcome barriers to participation and enhance data quality.
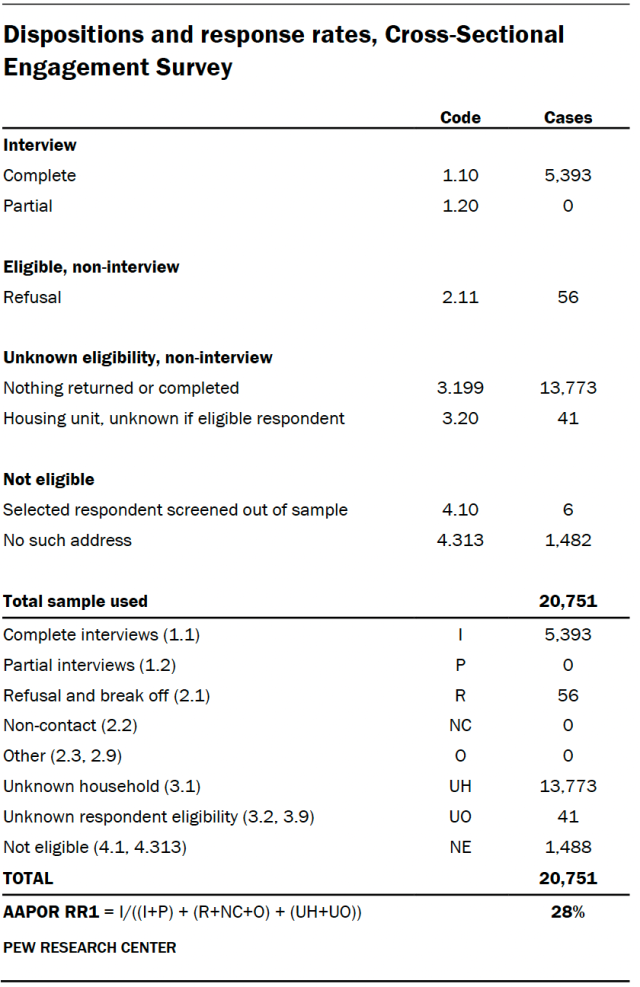
Response and Reach: In total, the survey successfully gathered responses from 5,393 individuals. Of these, 2,705 completed the survey online, 2,500 opted for the paper version, and 188 chose the telephone option. The survey was administered in both English and Spanish, further ensuring inclusivity. The AAPOR Response Rate 1, a standard metric for survey participation, stood at 28%. While seemingly modest compared to some panel surveys, this rate is considered robust for a cross-sectional address-based survey, especially given the challenges of reaching diverse populations in the contemporary environment. The multi-modal strategy, including physical mail and phone options, likely contributed significantly to achieving this response rate by offering flexibility to potential respondents.
Incentivizing Participation and Experimental Design: A key aspect of the mailing protocol involved the strategic use of incentives and embedded experiments. Initial mailings, sent in 9-by-12-inch window envelopes via first-class mail to 20,751 sampled addresses, included visible $1 bills. This "pre-incentive" is a well-established technique in survey research to increase initial engagement. The invitation letter provided a URL for the online survey, a toll-free number, and a unique password for access. To ensure within-household selection accuracy, the letter requested the adult with the next birthday to complete the survey, a standard method for randomizing respondent selection within households.
Two distinct experiments were embedded within this initial mailing to test factors influencing response rates. The first experiment assessed the effect of QR codes, with 65% of letters including a QR code and instructions for its use. The second experiment investigated the impact of cash incentives: 65% of letters contained two $1 bills, while the remaining 35% included one $1 bill. These experiments were fully and randomly crossed, allowing researchers to analyze the independent and interactive effects of these interventions on participation. Nonresponding households received reminder postcards and letters, further maximizing outreach. After the web data collection phase, nonresponding households with deliverable addresses received a Priority Mail package containing a visible $5 bill, a paper survey, and a postage-paid return envelope. A second paper questionnaire was sent via first-class mail to persistent nonresponders.
To manage the logistics of a large-scale mailing, the initial launch was split into a "soft launch" (5% of the sample) several days before the "full launch" (the remaining sample). This phased approach allows for early identification and resolution of any unforeseen issues. Furthermore, materials were provided in both English and Spanish for households in Hispanic strata or those predicted to be Hispanic, highlighting an adaptive approach to linguistic diversity. All participants who completed the survey received a $10 post-paid incentive, reinforcing the value of their contribution.
Questionnaire Development and Testing: The questionnaire itself was a product of collaborative development between Pew Research Center and SSRS. Rigorous testing was conducted on both desktop and mobile devices for the online version. Test data was thoroughly analyzed to verify the functionality of survey logic and randomizations before the official launch, ensuring data integrity and a smooth respondent experience.
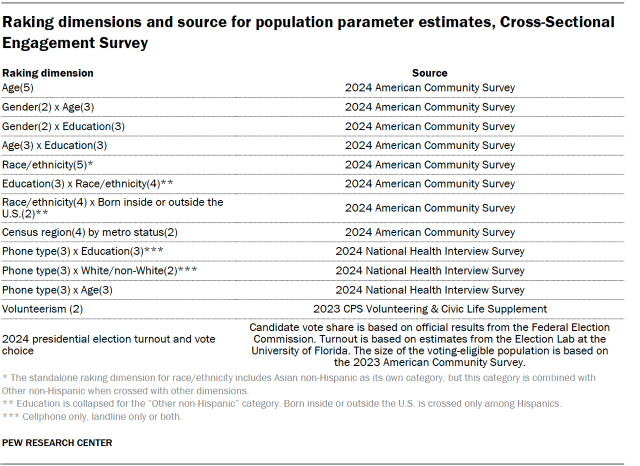
Weighting for Accurate Inference: To ensure that the survey findings could be reliably generalized to the U.S. adult population, a sophisticated multistep weighting process was employed. This began with a base weight, accounting for the probability of an address being selected from the Postal Service file and the number of adults in the household. An adaptive mode adjustment was also incorporated for cases responding via offline methods, acknowledging potential differences in these respondent groups. These base weights were then calibrated to population benchmarks using raking (iterative proportional fitting). Raking dimensions, which include critical demographic variables like age, gender, race/ethnicity, education, and region, were sourced from reliable population parameter estimates for the noninstitutionalized U.S. adult population (ages 18 and older). To prevent extreme weights from distorting results, weights were trimmed at the 1st and 99th percentiles, balancing precision with representativeness.
Design Effect and Margin of Error: The complexity of the survey design, particularly the stratified sampling and weighting, necessitates accounting for the "design effect" (deff). This statistical adjustment reflects the increase in variance of survey estimates compared to a simple random sample. For the 2025 Cross-Sectional Engagement Survey, the margin of error (half-width of the 95% confidence interval) for full sample estimates at 50% was plus or minus 1.9 percentage points, incorporating the design effect. It is a standard practice to report this, reminding readers that sampling error is just one component of overall survey error, with other factors like question wording and reporting accuracy potentially contributing additional error.
The American Trends Panel (ATP) Wave 179: Tracking Engagement Over Time
Complementing the cross-sectional study, data from Wave 179 of the American Trends Panel (ATP) provided further insights into how engagement links with Americans’ views on politics and news, and their knowledge about political issues. The ATP is Pew Research Center’s nationally representative panel of randomly selected U.S. adults, designed to track public opinion and trends over time.
Overview and High Response Rate: This particular wave was conducted from September 8 to September 14, 2025, a much shorter field period than the cross-sectional survey, which is typical for established panels. A remarkable 5,195 panelists responded out of 5,852 sampled, yielding an exceptionally high survey-level response rate of 89%. This significantly higher response rate compared to the cross-sectional survey is characteristic of panel studies, where participants have already committed to ongoing participation. However, it is crucial to consider the cumulative response rate, which accounts for nonresponse to initial recruitment surveys and subsequent panel attrition, standing at 3%. This metric provides a more holistic view of the representativeness from the initial population draw. The margin of sampling error for the full ATP sample was plus or minus 1.6 percentage points.

Strategic Oversampling: Wave 179 included an oversample of non-Hispanic Asian adults. This deliberate strategy aims to provide more precise estimates for smaller demographic subgroups that might otherwise be underrepresented in a standard national sample. These oversampled groups are subsequently weighted back to reflect their correct proportions within the overall U.S. population during analysis, ensuring overall representativeness.
Panel Recruitment and Evolution: Since 2018, the ATP has utilized address-based sampling (ABS) for recruitment, aligning with the methodology of the Cross-Sectional Engagement Survey. This involves mailing study cover letters and pre-incentives to a stratified, random sample of households selected from the U.S. Postal Service’s Computerized Delivery Sequence File, which is estimated to cover 90% to 98% of the population. Within each sampled household, the "next birthday" method is used to select an adult participant. Prior to 2018, the ATP relied on landline and cellphone random-digit-dial (RDD) surveys for recruitment. Recruitment for the ATP occurs approximately once a year, sometimes including additional oversampling efforts for groups like Hispanic, Black, or Asian adults to enhance data accuracy for these populations.
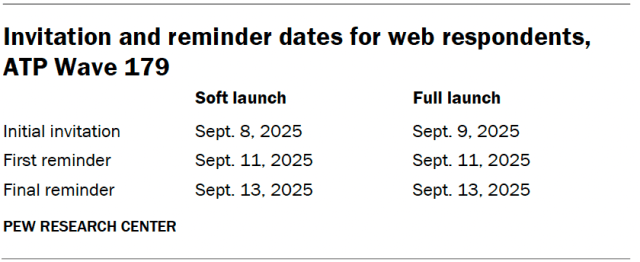
Data Collection and Incentives for Panelists: SSRS conducted Wave 179 via online (4,986 respondents) and live telephone (209 respondents) interviewing, in both English and Spanish. The data collection protocol for online panelists involved email invitations and up to two email reminders, with SMS invitations and reminders also sent to those who consented. For phone panelists, prenotification postcards were mailed, followed by up to six calls from trained SSRS interviewers. A soft launch (60 panelists online, 7 interviews by phone) preceded the full launch for both modes, allowing for early system checks.
Panelists were offered a post-paid incentive for their participation, ranging from $5 to $15. This differential incentive strategy is designed to boost participation among groups traditionally harder to reach, thus improving the panel’s overall representativeness and reducing potential nonresponse bias. Respondents could choose to receive their incentive as a check or a gift code for major online retailers.
Questionnaire Development and Data Quality: Similar to the cross-sectional survey, the ATP Wave 179 questionnaire was developed collaboratively by Pew Research Center and SSRS. It underwent rigorous testing on both PC and mobile devices, with test data analyzed to ensure logic and randomizations functioned as intended. To uphold data quality, researchers performed checks to identify "satisficing" behaviors (e.g., leaving many questions blank, always selecting the first/last answer). As a result, four ATP respondents were removed from the dataset prior to weighting and analysis, ensuring the integrity of the collected data.
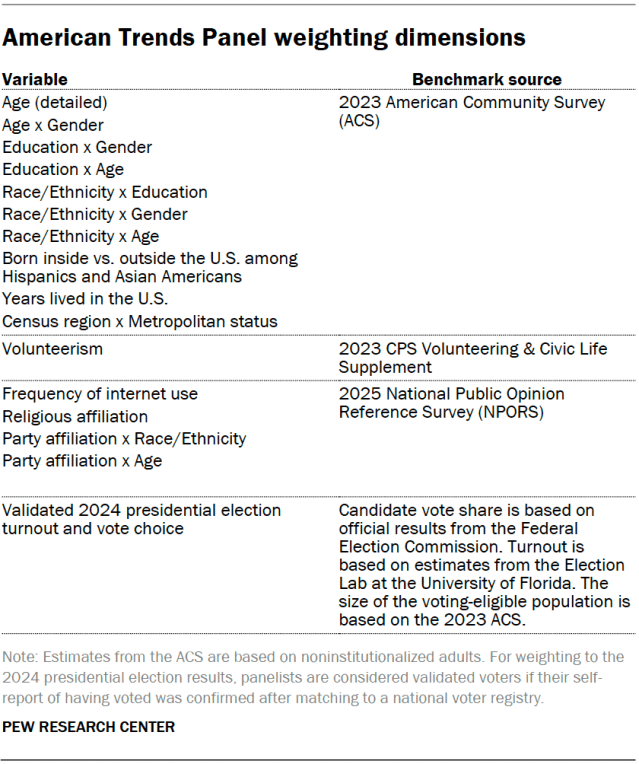
Multi-Stage Weighting for Panel Data: The weighting process for ATP data is more complex, accounting for multiple stages of sampling and nonresponse inherent in panel studies. Each panelist starts with a base weight reflecting their probability of recruitment into the panel. These weights are then calibrated to align with population benchmarks, correcting for nonresponse to recruitment surveys and panel attrition. If only a subsample of panelists was invited to a particular wave, this weight is further adjusted. Finally, among those who completed the survey, the weight is calibrated again to population benchmarks and trimmed at the 1st and 99th percentiles. This meticulous, multi-stage weighting ensures that the final data accurately reflects the U.S. adult population, despite the inherent complexities of panel maintenance and participation.
Engagement Group Creation and Analysis: Unveiling Typologies of Public Life
A significant analytical component drawing on the 2025 Cross-Sectional Engagement Survey data was the creation of "engagement groups." This involved using cluster analysis to categorize Americans into distinct groups based on their patterns of participation in public life across politics, religion, news consumption, and other civic activities.
Methodology and Input Variables: The approach identifies individuals who share similar engagement patterns, providing a more granular understanding than broad demographic categories alone. Group assignment was determined by respondents’ answers to 19 specific questions about their behavioral participation in these areas. Critically, only behavioral items were used for clustering, excluding attitudinal, demographic, or identity-based questions. This ensures the groups are purely defined by how people engage. The selection of these 19 items was based on extensive testing to identify a model that best fit the data and yielded substantively meaningful groups. These items included questions on volunteering, group membership, attending local government meetings, following national and local news, discussing news, online news engagement (liking, posting, sharing), political donations, non-political donations, various forms of civic engagement (working for campaigns, displaying political support, contacting officials, participating in protests), and religious service attendance (in-person and online), as well as voting in the 2024 presidential election.
The specific statistical technique employed was weighted clustering around medoids, using the WeightedCluster package in R. This k-medoids algorithm assigns respondents to groups characterized by differing response patterns. Pew Research Center has a history of using similar or related methods (e.g., k-means algorithm) for its typologies.
Rigorous Methodological Decisions: The researchers acknowledged that various decisions in cluster analysis can significantly impact results. Therefore, extensive testing was performed regarding the algorithm, variable coding, and number of clusters. Input variables were coded using their original response formats (binary or scaled), without standardization, as Gower’s distance – suitable for mixed data types – was used to compute distances between respondents. Prior to clustering, data quality checks identified and excluded 13 respondents with nine or more missing items among the 19 input variables, as their limited data prevented reliable classification. For the remaining 5,380 respondents, partial item nonresponse was handled by Gower’s distance, which calculates distances based on available responses, minimizing the impact of missing data.
Multiple solutions with different numbers of groups were examined, with the final selection based on its effectiveness in producing cohesive, distinct, and analytically practical groups. To ensure robustness, each model was run multiple times. The k-medoids algorithm proved robust, consistently returning the same results even with different random starts, lending confidence to the stability of the identified engagement groups.
Projecting Engagement Clusters to ATP Wave 179: To further enrich the analysis, the engagement groups derived from the cross-sectional survey were projected onto respondents of ATP Wave 179. This crucial step allowed researchers to analyze how these engagement groups differ in terms of attitudes (e.g., trust in news, feelings about the country) and civic knowledge – questions that were not included in the cross-sectional survey due to space limitations but were present in the ATP. This projection was achieved by assigning ATP respondents to the engagement groups based on the similarity of their behavioral patterns to those of the most typical respondents (medoids) in each group from the cross-sectional survey, using the same Gower’s distance metric and consistent variable coding. This innovative approach effectively bridges the two surveys, leveraging the depth of the ATP’s attitudinal data while maintaining the foundational integrity of the engagement groups established in the larger cross-sectional study. The ATP results, when mapped to these engagement groups, were found to be broadly consistent with the cross-sectional survey in both engagement patterns and demographics, reinforcing the validity of the classification.
Broader Implications and Commitment to Transparency
The detailed methodological descriptions for both the 2025 Cross-Sectional Engagement Survey and ATP Wave 179 highlight Pew Research Center’s unwavering commitment to methodological transparency and rigor. In an era of increasing skepticism toward survey data and declining response rates, the adaptive, multimode sampling strategies, the use of incentives, and the sophisticated weighting techniques are critical for producing reliable and representative findings. The embedded experiments within the cross-sectional survey also demonstrate an ongoing effort to innovate and optimize survey practices.
The creation of engagement groups through advanced cluster analysis provides a powerful framework for understanding the multifaceted nature of public participation, moving beyond simplistic demographic categorizations. By meticulously detailing how these groups are formed and how they are linked to the ATP data, Pew Research Center empowers researchers and the public alike to critically evaluate the findings and appreciate the depth of analysis. This comprehensive methodological disclosure not only enhances the credibility of the research but also contributes valuable insights to the broader field of survey science. The findings derived from these robust methodologies are expected to significantly advance public understanding of American engagement in civic life, politics, and the media.
Related posts: