In the contemporary digital landscape, the volume of data generated by social media platforms is overwhelming. For marketing professionals and business owners, the sheer quantity of available metrics—from simple likes to complex conversion paths—often creates a paradox of choice. However, in the world of data-driven marketing, more is not necessarily better. Distinguishing between vanity metrics and actionable insights is the fundamental challenge of modern digital strategy. Effective social media management requires a transition from passive observation to strategic analysis, where metrics are curated specifically to measure progress toward defined business objectives.

Understanding the Distinction: Metrics vs. Key Performance Indicators
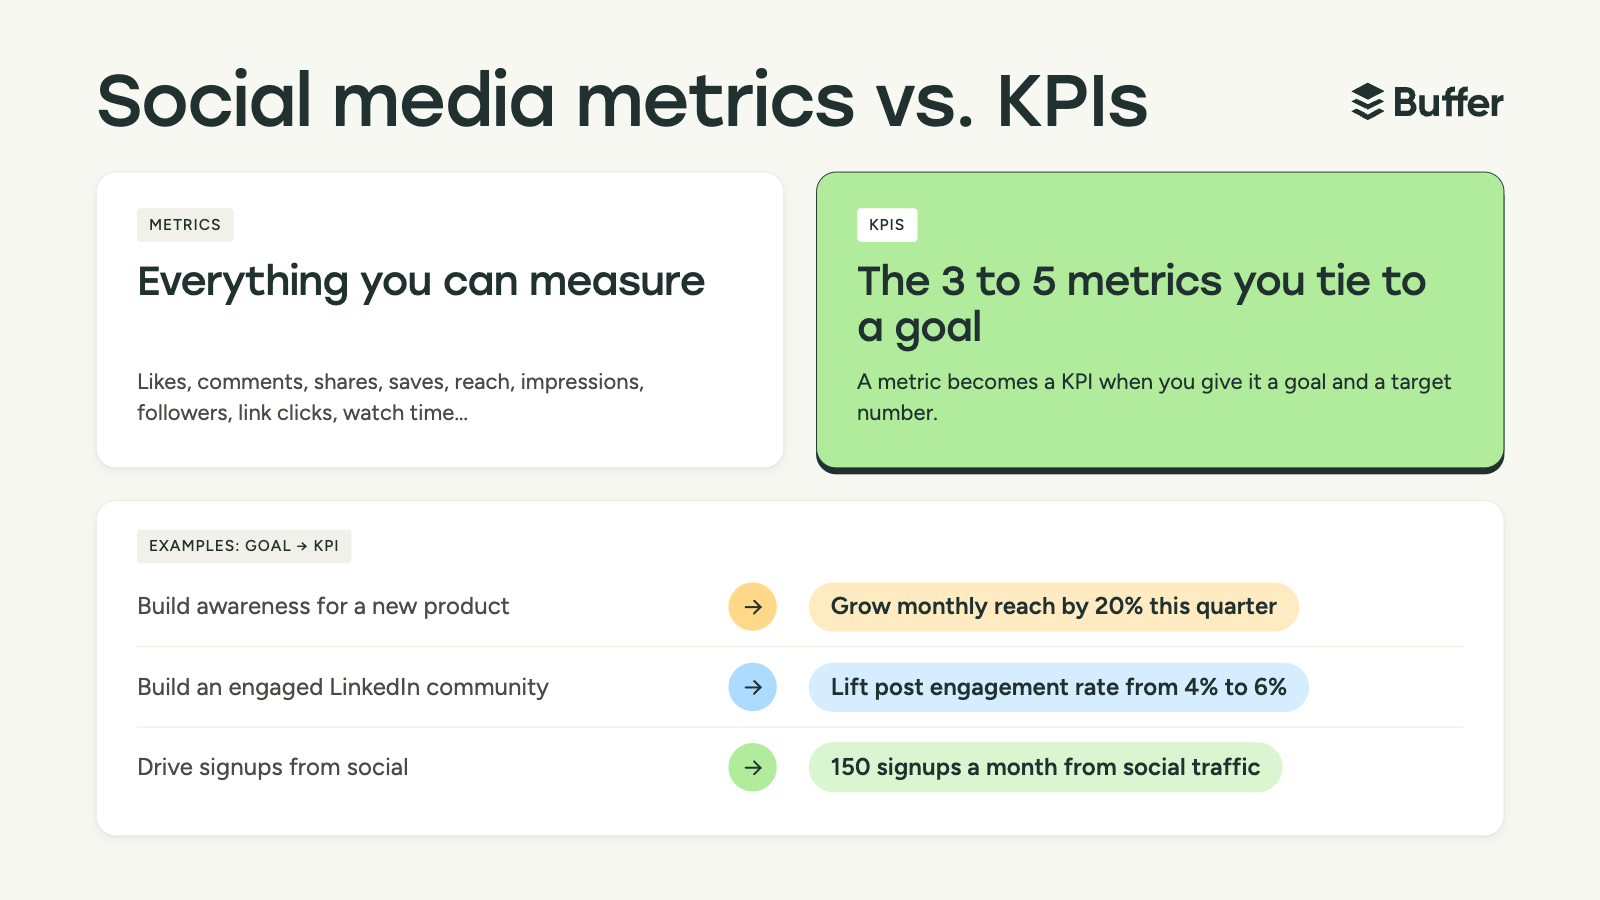
To navigate the analytics dashboard effectively, one must first understand the distinction between a social media metric and a Key Performance Indicator (KPI). A metric is any data point that can be measured, such as the number of followers, individual post impressions, or total comments. These serve as raw inputs. A KPI, conversely, is a strategic filter applied to those metrics. A metric becomes a KPI only when it is tethered to a specific business goal and a quantifiable target.
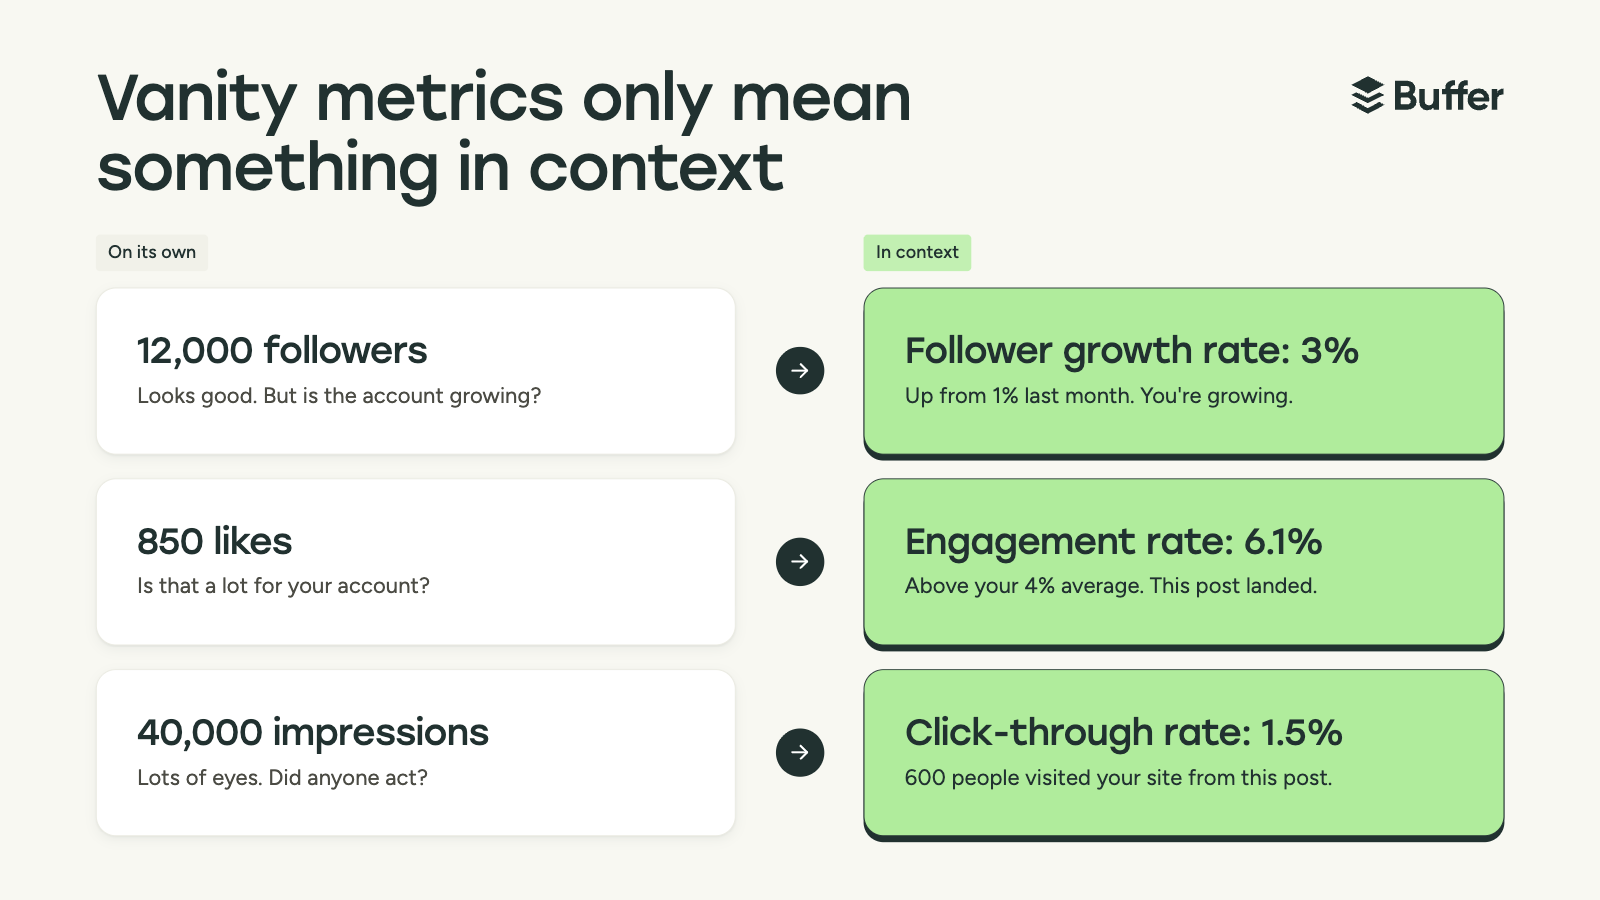
For instance, "total reach" is a metric. However, "increasing brand awareness by 15% through a 20% growth in unique account reach over the next quarter" is a KPI. By tying the raw data to a specific, time-bound objective, marketers can determine whether their efforts are yielding the desired return on investment (ROI). Relying on isolated metrics without context leads to what industry experts describe as "vanity metrics"—numbers that may look impressive on a report but offer no guidance for future strategic adjustments.
The Chronology of Analytics: From Engagement to Conversion
The lifecycle of a social media campaign typically moves through four distinct stages: awareness, engagement, community interaction, and conversion. Tracking performance requires a balanced view across these stages.
-
Awareness (The Reach Phase): At this stage, the primary concern is the visibility of the content. Reach and impressions act as the leading indicators. Reach measures the number of unique accounts that have viewed a post, whereas impressions represent the total number of times content has been displayed. A divergence between these two figures provides a clear signal: if impressions significantly exceed reach, the content is being viewed repeatedly by the same audience, indicating high loyalty or a potential lack of new audience penetration.
-
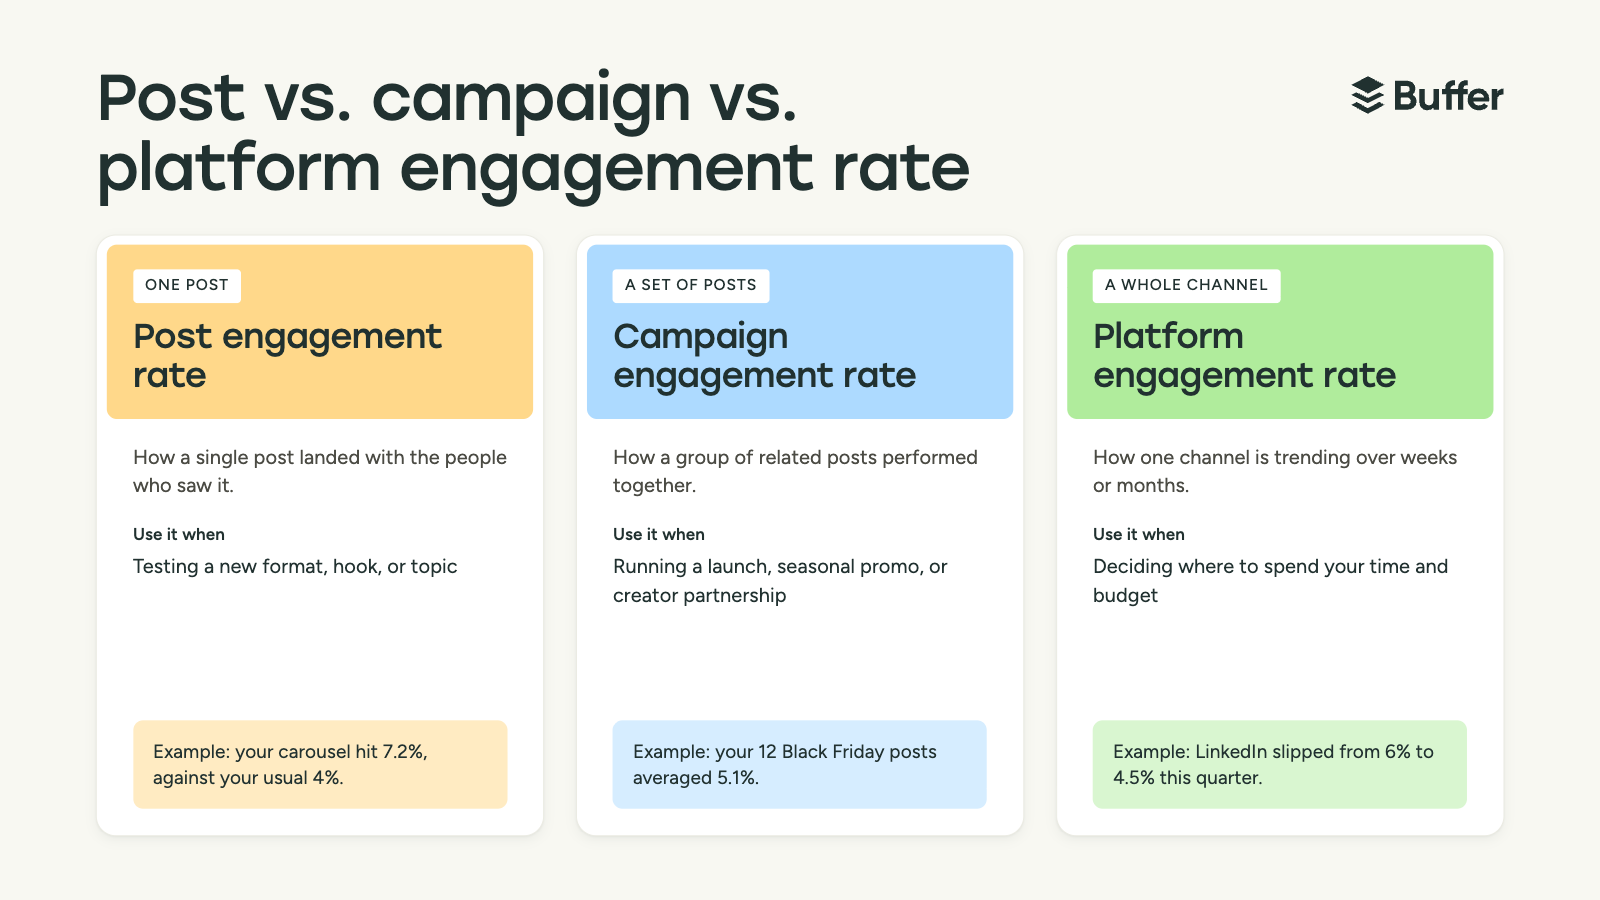
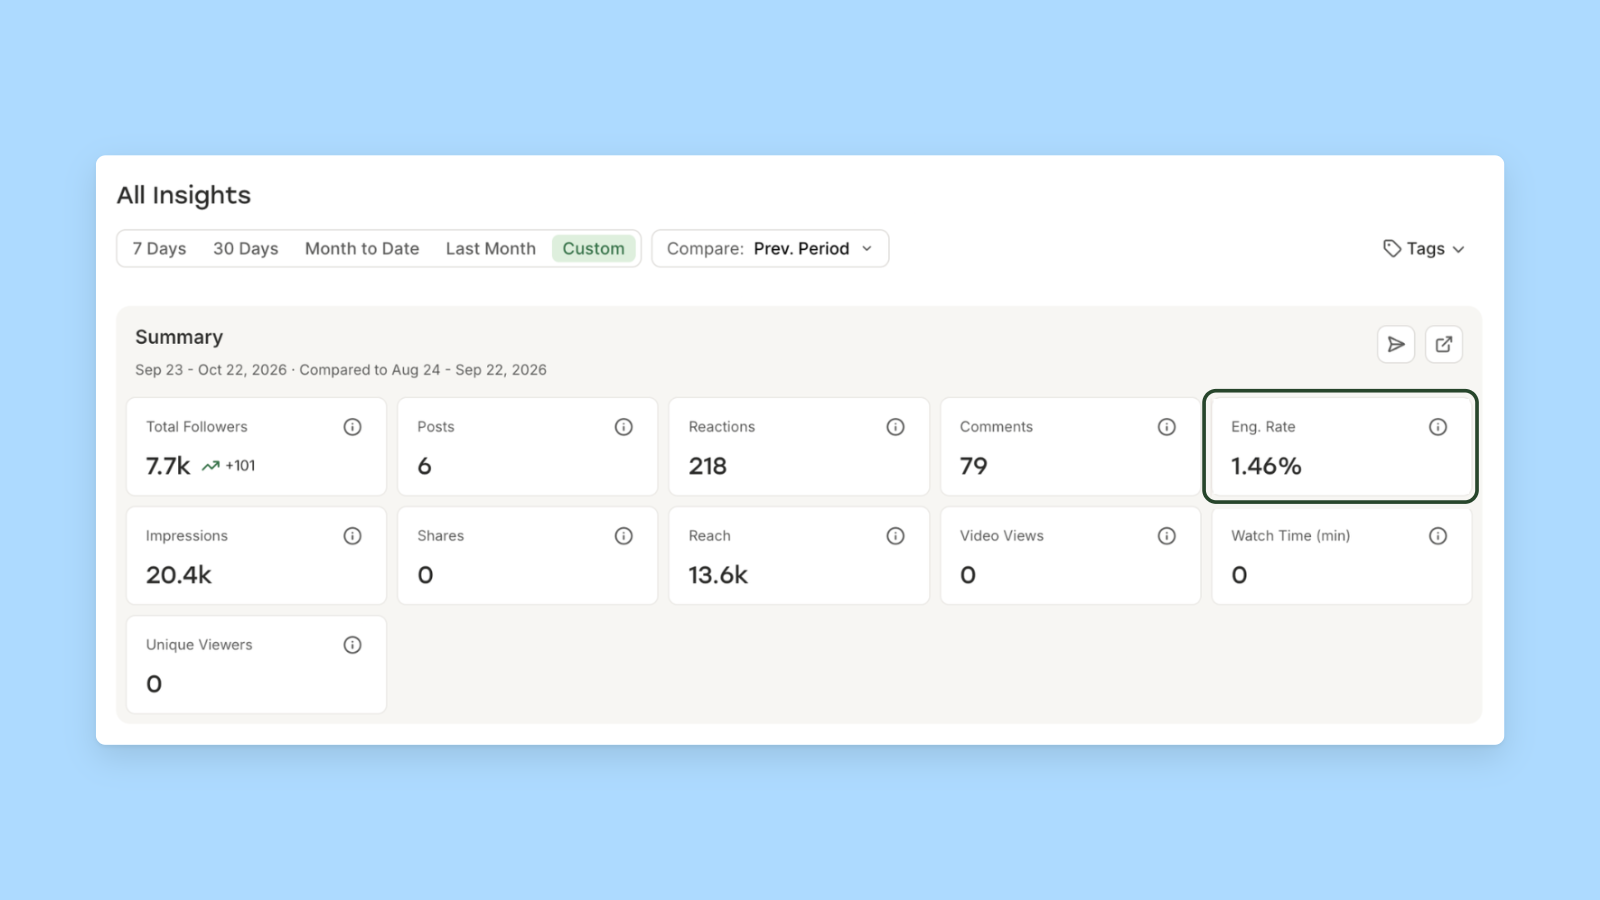
Engagement (The Interaction Phase): Once content is visible, engagement metrics assess its resonance. The engagement rate—calculated by dividing total engagements by reach—is the gold standard here. In 2025, industry benchmarks suggested median engagement rates varied significantly by platform: LinkedIn maintained a median of approximately 6.2%, while platforms like X (formerly Twitter) saw engagement rates around 2.5%. Understanding these medians is vital; comparing a 4% engagement rate on LinkedIn (which is below the median) to a 4% rate on X (which is well above) provides necessary context for performance evaluation.
-
Community (The Relationship Phase): Beyond simple reactions, qualitative engagement—such as comments and shares—indicates the strength of the community. Data from over two million posts suggests that brands which actively reply to user comments experience higher overall engagement. This suggests that the relationship between a brand and its audience is reciprocal, not merely broadcast-based.
-
Conversion (The Outcome Phase): The final stage involves moving users off the social platform and into the sales funnel. Metrics like Click-Through Rate (CTR) and Conversion Rate are essential here. A high CTR, achieved through the use of UTM-tracked links, demonstrates that the content is successfully compelling users to take action.
The Role of Data-Driven Decision Making
The implementation of robust analytics serves a critical purpose: informing the next creative cycle. Professional marketing teams utilize "A/B testing" and iterative design to improve these figures over time. For example, if a brand observes that its average watch time for video content is dropping at the five-second mark, the analytical implication is clear: the video’s "hook" is failing to capture attention. By adjusting the pacing or the opening visual, the marketer can directly impact the retention rate.

Similarly, audience demographics—often overlooked in favor of vanity metrics—provide the roadmap for content strategy. If a company’s follower demographics do not align with their ideal customer profile, the implication is that the current content strategy is either misaligned or targeting an irrelevant segment. Adjusting the tone and subject matter to resonate with the target demographic is a standard procedure for aligning social output with business objectives.
Financial Metrics and ROI Attribution
For businesses running paid social campaigns, the focus shifts to financial indicators. Cost-per-click (CPC) and Cost-per-thousand-impressions (CPM) are the primary gauges of ad efficiency. However, the most critical metric for executive stakeholders remains the Return on Ad Spend (ROAS).
Modern analysis has shifted toward "Blended ROAS," which aggregates revenue across all channels—including organic social, email, and direct web traffic—and compares it against total advertising spend. This approach acknowledges that social media often acts as an upper-funnel touchpoint that facilitates conversions elsewhere in the ecosystem. Relying solely on platform-native attribution can be misleading due to privacy-focused changes in data tracking, such as cookie restrictions, which often underreport the influence of social media on the final sale.
Industry Standards and Institutional Response
Industry leaders and social media analytics firms, such as Buffer, consistently advocate for a "less is more" approach to reporting. By focusing on three to five core KPIs, organizations avoid the clutter of superfluous data. The consensus among digital marketing directors is that virality is an unstable and often unreliable goal. Instead, the focus should be on consistent, incremental growth that aligns with long-term brand health.

The broader implication of this data-focused era is the professionalization of the social media manager role. It is no longer sufficient to be a creator; one must also be an analyst. The ability to interpret a shift in brand sentiment—measured through social listening tools that categorize mentions as positive, negative, or neutral—is now as important as the ability to design a high-performing visual.
Strategic Implications for Future Planning
As we move toward 2026 and beyond, the integration of AI-driven analytics is expected to automate the identification of these patterns, allowing marketers to spend less time on data collection and more on strategic execution. However, the core principles remain constant:

- Establish a Baseline: Before setting targets, one must know the starting point. Without historical data, there is no way to define success.
- Contextualize Performance: Always compare performance against the platform’s median, not against other channels or competitors.
- Actionability is Key: If a metric does not provide a clear path to an operational or strategic change, it should be relegated to the background.
In conclusion, the effective management of social media metrics is a rigorous discipline. By prioritizing actionable data over vanity figures and aligning every metric with a specific, quantifiable KPI, organizations can transform their social media presence from a subjective activity into a predictable, measurable engine for growth. The goal is not merely to be seen, but to influence, to engage, and ultimately, to convert in a manner that serves the broader mission of the enterprise.